


.svg)


Win-Loss Analysis
|
Use Case


Learn how we capture in-depth buyer feedback—and how it can transform your business.
Book a demoSummary
Key takeaways
Knowing your sales win rate is the foundation of a predictable revenue engine. While calculating your win rate by count or amount tells you what is happening in your pipeline, revenue leaders must ultimately pair this metric with direct buyer feedback to understand why deals are won or lost.
Every revenue leader knows they need to track their win rate. But what exactly does it mean? Are there different ways to calculate it? And most importantly, how can you use it to impact your business strategy?
To understand how your win rate affects critical business outcomes, we first need to understand the basic definitions and the exact formulas used to calculate it.
You may hear salespeople brag about “closing” deals, but the term closed opportunity actually refers to any deal that comes to a final end in your CRM—whether it was won or lost. (As a side note, this definition sheds some light on why we named our company “Clozd.”)
To calculate an accurate win rate, you can only look at deals that have reached a definitive closed-won or closed-lost status.
Win rate by count is the ratio of individual deals won compared to the total number of closed opportunities. This calculation answers the fundamental question: “How often do I win?”
The Win Rate Calculation Formula (By Count):(Total Deals Won ÷ Total Closed Opportunities) x 100 = Win Rate %
For instance, if your sales team closed 8 total deals in the past month, and 2 of those were wins, your win rate by count is 25% (2 ÷ 8 = 0.25).
How you measure win rate matters. Another highly effective measurement is calculating your win rate by amount, or monetary value (such as ARR or MRR). This answers a slightly different question: “What percentage of the cash in my pipeline am I actually winning?”
The Win Rate Calculation Formula (By Amount):(Total Dollar Value of Won Deals ÷ Total Dollar Value of All Closed Deals) x 100 = Win Rate %
Looking at the previous example, let’s say the 2 deals you won were worth $40,000 each ($80,000 total), and the sum total of all 8 closed deals was $140,000. Your win rate by amount is 57.1% ($80,000 ÷ $140,000).
Even though you only won 25% of your total deals, you captured 57.1% of your potential revenue because you won the largest deals in your pipeline.
You should measure both. Looking at both calculations side-by-side provides a balanced view of your sales productivity.
Win rate by count is excellent for forecasting. If you know your average deal size and your win rate by count, you can accurately estimate exactly how many opportunities your team needs to add to the pipeline to hit next quarter's quota.
In contrast, win rate by amount sheds light on the size of deals your team excels at winning. You may notice that a specific territory struggles to close high-dollar enterprise accounts but excels at high-velocity, low-dollar transactions.
Context is everything. By itself, an average sales win rate of 25% only gives you a glimpse into what’s happening. Is that good or bad? How did it get that way? The formula alone cannot answer these questions.
If you start to apply dimensions to your win rate analysis, you’ll derive richer insights:
Clozd offers a customizable CRM integration that allows you to easily monitor your company's win rate. Request a demo today.

Understanding your average win rate is a foundational piece of revenue operations. But ultimately, CRM data and formulas only tell a part of the story. They tell you what is happening in your pipeline, but not necessarily why.
To truly understand why you win and lose—and how to fix it—you need direct feedback from the decision-makers at those won and lost accounts.
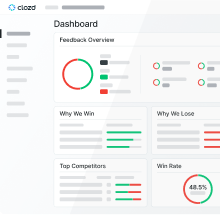
Establishing a formal win-loss analysis program eliminates internal guesswork. Clozd can help you implement an ongoing feedback loop that centers on third-party buyer interviews. By figuring out the exact root causes of why you win and lose, you can actively start winning more.
.svg)
Ike Nwabah | VP of Marketing

Tripp R. | Global Competitive Insights Manager
Gary C. | VP of Product Marketing


.png)
.png)

.svg)