


.svg)


BLOG POST
|
4


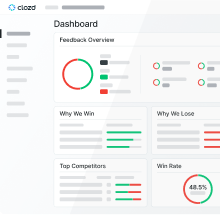
Win-loss analysis is the practice of interviewing actual buyers from your won and lost accounts to uncover key insights about how those buyers actually perceive your offering, what they care most about, how you stack up against your competitors, how you can build sustainable competitive advantage, and more.
Transformational win-loss programs have the potential to drive meaningful and measurable outcomes for businesses that rely on complex B2B selling to drive revenue. At Clozd, we have learned from practical experience that there are a variety (typically 3) ways that our win-loss programs directly increase revenue.
Win-loss analysis will transform how you train and develop your sales team. The insights and learnings from win-loss analysis will equip your sales team with increased confidence, greater empathy, and deeper knowledge.
As a result, win rates will increase.
In our experience it is not uncommon for clients to observe at least a 10% improvement in win rates during the first year of implementing a Clozd win-loss program. Likewise, a Gartner study found that certain companies observed as much as a 50% improvement in win rates. For a company that has historically generated $10,000,000 with a 20% win rate, a 10% improvement (improve to 22% win rate) would have an incremental impact of $1,000,0000 on sales revenue.
Win-loss analysis will transform how you train new sales hires. Win loss analysis gives new reps an in-depth perspective on real deals that have been won and lost by their more experienced peers. It’s the equivalent of shadowing dozens of sales calls in next to no time at all.
As a result, sales reps will ramp faster and hit quota sooner.
In our experience it is not uncommon for clients to observe a 25% decrease in average ramp time of new hires, from start date to hitting quota. For a sales org that hires 5 new sales people during the year with quarterly quotas of $200,000 this could be the equivalent of an entire extra quarter of sales production. Multiply the quarterly quota ($200,000) by the number of new hires (5) and you’re dealing with incremental sales revenue of $1,000,000 during the year due to faster ramping.
An unintended benefit of many win loss programs is the chance to revive deals that were considered lost by your sales team. In our experience there will almost certainly be cases where the interview with the buyer will surface issues that could have been addressed differently had they been known during the sales cycle. That’s why Clozd consultants pay particular attention to opportunities that might be worth reviving and we even ask permission of the client to re-surface the opportunity.
In our experience it is not uncommon for clients to revive and win multiple sales opportunities each year.
For example, one company used win-loss data to identify 10 high profile opportunities that they could reconnect with. Eventually, 3 of those accounts were closed for incremental revenue of more than $300,000. While this sort of incremental revenue is harder to predict, it’s an inevitable side effect and benefit of an investment in win-loss analysis.
With these 3 opportunities for revenue generation in mind, let’s take a look at how we can estimate the potential ROI for a program.
First, you’ll need known inputs from your existing sales efforts such as:
Second, you’ll need to make some assumptions.
If you are unsure, we recommend using a 10% increase for both of these assumptions. Then, use the assumption to calculate the new win rate using the formula: Current Win Rate x (1 + Anticipated Win Rate Increase in decimal form). For example, if your current win rate is 20% and you expect a 10% increase, the new win rate would be 22% (not 30%).
Third, you’ll need to estimate the total cost of your win-loss program.
This number varies widely for Clozd clients based on the scope of services included, the number of interviews conducted, and other factors. If you don’t have a program quote from Clozd already, use the button below to contact our team so we can develop one for your unique needs.
Once you have the inputs and assumptions mentioned above, the ROI calculation is relatively easy.
Click here to access our win-loss analysis revenue calculator, or continue reading to do it yourself.
Let’s start with incremental revenue from an increase in win rate:
Record the result.
Add any expected incremental revenue from decreased sales ramp time and incremental revenue from revived deals (assume 1-3 deals per year multiplied by average deal size).
For example, let’s assume you define your inputs and assumptions as follows:
First, let’s calculate the revenue impact of a 10% increase in win rate:
So, a 10% improvement in win rate will result in $1,000,000 of incremental sales revenue per year.
Second, let’s calculate the revenue impact of a 10% decrease in ramp time:
So, a 10% decrease in ramp time will result in $500,000 of incremental sales revenue per year.
Third, let’s calculate the revenue impact of the deals that may be revived due to win loss interviewing. We recommend assuming that you will win 3 revived deals per year.
So, the revival and closing of 3 lost opportunities per year would result in $150,000 of incremental sales revenue per year.
Finally, add up the outputs from the three exercises above.
So, based on these assumptions there would be $1.65 million of estimated incremental revenue per year from implementing a win-loss program.
The last step is to compare that increase to the total cost of ownership of your win-loss initiative. In this, and most cases, the return far outweighs the cost of implementing win-loss analysis.
Note: The assumptions we provide (10% increase in win rate, 10% reduction in ramp time, and 3 revived deals per year that close) are conservative estimates that you should feel comfortable using in your projections. Chances are you will experience higher incremental revenue than you project in at least one of the three areas of opportunity.
.svg)
Ike Nwabah | VP of Marketing

Tripp R. | Global Competitive Insights Manager
Gary C. | VP of Product Marketing


.png)


.svg)