


.svg)


Retention AnalysisThe ultimate guide to analyzing customer churn
Every company needs to analyze churn data to determine pain points in their services that lead to customer loss. If your company isn't already doing this, you're missing out on critical information about why your customers are leaving, where you're losing money, and much more.
Read on to learn more about churn analysis with Clozd—and how it can improve your business in a number of ways.


Customer acquisition cost
Customer acquisition cost (CAC) is the total cost related to acquiring a new customer. This includes the cost of all sales and marketing strategies that aim to attract new business.
CAC is usually significantly higher than a company’s costs to retain current customers. According to an HBR article, acquiring a new customer is anywhere from five to 25 times more expensive than retaining an existing one. This means that the more customers you lose, the more your company will have to spend to replace them with new customers.
Happy customers don’t churn. They also help with one of the best channels of sales and marketing—word of mouth. Increasing sales opportunities from word of mouth can be one of the best ways to reduce CAC, reduce sales cycles, increase win rate, and ultimately grow revenue.
Clozd’s churn and retention research helps companies uncover the specific reasons their happiest customers stay loyal—so they can replicate that success across their customer base.
Analyze churn to reduce it
The more you know and understand about your churn rate, the more you can improve it. Companies need to know every area that is causing them to lose customers and create targeted action plans to address and prioritize the causes of customer churn. If you aren't analyzing your churn rate, you can't improve it to make your business better.
Clozd’s Live and AI-powered Flex Interviews help companies capture direct, candid feedback from both retained and churned customers—so you can go beyond the numbers and uncover the root causes of attrition.

When to do churn analysis
Ideally, your company should have a steady pulse of your churn. This helps build a customer-centric culture and keeps sales revenue in the door. Although actually calculating your churn rate and analyzing its causes deeper tends to be done annually, this can also depend on what your average contract length looks like. For example, if your average contract length is six months, it would be most beneficial to conduct churn analysis every six months.
Another great time to do a churn analysis is a specific time period after you've introduced a new product or service. You can get valuable insight into whether these new offerings are performing well, if they are stagnating, or if they are losing you customers.
Churn analysis also becomes a hot topic inside of a company when a high-profile customer is lost. They could have been a major percentage of revenue or a key strategic deal in a new market. Be careful not to fall into the trap of recency bias and use one deal to guide strategy for your entire customer base.
In general, if you aren't noticing concerning numbers and you haven't introduced new goods or services, it's still a good idea to perform a churn analysis at the end of every year. Doing this gives you continued insight into your company's performance and can help you game plan for the future. It is also a key business metric for measuring the health and future success of your business.
How to do churn analysis
Before you do a churn analysis, you need to figure out the scope and direction the analysis should take. To figure this out, use your overall churn rate or industry standards as a baseline, and customer information to guide you on where to look deeper.
Two ways churn rate can be calculated are by customer churn or revenue churn. Select the time period that makes sense to your business. If you are working with annual contracts use a year as the time period to calculate churn rate.
Customer churn simply means the number of customers (i.e., logos, accounts, etc.) that you lost in a certain period. For example, let’s say you had 100 customers at the beginning of the year. Out of those 100 customers, you lost 10 of them during the year. You would calculate your customer churn rate like this:
(# of Lost Customers / Total Customers) x 100 = Customer Churn Rate Percent
or from the example above: (10 / 100) x 100 = 10% Customer Churn Rate
Revenue churn shows how much revenue a company loses from churned customers. Using the example above, let’s say that the 10 customers that were lost each had an annual contract value of $10,000. Let’s also assume that the remaining customers had annual contracts for $20,000 each. The total revenue lost (10 x $10,000) ends up being $100,000 and the retained revenue is $1,800,000 (90 x $20,000). Taking this information you can then calculate your revenue churn rate like this:
(# of Lost Customers / Total Customers) x 100 = Customer Churn Rate Percent
or from the example above: (10 / 100) x 100 = 10% Customer Churn Rate
Now that you know your overall baseline churn rate, it is time to identify problem areas where the churn is higher. You can see from the sample above that by also calculating the revenue churn rate alongside the customer churn rate, a pattern of excess loss develops in deals with smaller than average contract values. Taking this information you can look for similarities with these customers and look for signs of loss reasons.
Next, it is time to dig deeper. The process of digging deeper can be broken down into a few steps.
Churn analysis in 4 steps
Customer acquisition cost
Many companies don’t have the bandwidth to fully investigate every lost deal. You should start breaking down the churn rate by different factors in your CRM. With your baseline or overall churn rate start looking more specifically at trends in different regions, by products, size of the customer companies, pricing and packaging differences, or other factors.
This will be specific to your business. Perhaps you notice that when a specific feature of your product offering is not included in the pricing and packaging the churn rate is significantly higher versus when the feature is included. Or your company offers tiered service plans. You could analyze all of these churn rates together but you’ll get a general overview of customer churn information.
However, if you were to analyze churn rates by subscription level or other smaller segments, you can get more accurate information about customer attrition. Say your customers in subscription level one are holding strong with minimal loss, but those in level two are dropping like flies. You want to understand the churn rates for level two specifically—not levels one and two together.
Once you have your specific churn rate numbers you can prioritize what your churn analysis is trying to discover, the scope it should take, point it in the right direction, and determine what data channels to use.
Step 2: Choose your churn analysis data channels
There are several data channels you can utilize to understand why customers left. This could include CRM information, customer surveys, internal surveys, and customer interviews.
Clozd’s AI Interviews and Live Interviews are designed to uncover the “why” behind churn. Live Interviews let you talk directly to key decision-makers to capture nuance and context that a checkbox survey can’t reveal. AI Interviews make it easy to collect honest feedback at scale from champions, users, or churned accounts—helping you understand the value customers are seeing (or missing).
Each interview is recorded and transcribed in real time within the Clozd Platform, where generative AI highlights themes, tags keywords, and surfaces decision drivers—so your team can quickly act on the insights that matter most.
Step 3: Determine why customers are churning
The main purpose of a churn analysis is to determine why your customers are canceling or leaving your services. While you can get some general information just based on the numbers you’re seeing, the best way to get the most accurate churn information is to talk to your lost customers.
Clozd consultants conduct probing, adaptive interviews that help you uncover the real reasons behind customer attrition. Customers are far more likely to open up to an impartial third party, which helps you capture honest, actionable feedback and identify opportunities for improvement.
The Clozd viewpoint of churn analysis is a little different from the status quo. Though most research focuses on lost customers, Clozd also captures insights from customers who renew or expand—revealing what’s driving loyalty and growth, not just loss.

How to do churn analysis
Before you do a churn analysis, you need to figure out the scope and direction the analysis should take. To figure this out, use your overall churn rate or industry standards as a baseline, and customer information to guide you on where to look deeper.
Two ways churn rate can be calculated are by customer churn or revenue churn. Select the time period that makes sense to your business. If you are working with annual contracts use a year as the time period to calculate churn rate.
Customer churn simply means the number of customers (i.e., logos, accounts, etc.) that you lost in a certain period. For example, let’s say you had 100 customers at the beginning of the year. Out of those 100 customers, you lost 10 of them during the year. You would calculate your customer churn rate like this:
Which metrics matter?
As you perform a churn analysis, look at the following key performance indicators (KPIs), which are used to measure the financial impact of churn.
LTV
The lifetime value (LTV), also known as the customer lifetime value, is essentially how much predicted revenue a company can get from a single customer during the time period they are a customer, otherwise called the customer lifetime.
It is simple to calculate LTV for a single customer. Say you charged a customer $10,000 a month for your service and the customer stays with you for 12 months. Their LTV is calculated like this:
$10,000 x 12 = $120,000
To calculate what your average LTV is across the business you’ll need to know the average revenue per account * average customer lifetime value.
ARPA
Average revenue per account (ARPA) is essentially how much revenue a company can get from a single customer account over a specific period of time. If you are looking on a monthly basis you’d calculate ARPA by dividing your monthly recurring revenue by the total number of accounts. (Monthly recurring revenue / total accounts = ARPA)
MRR
MRR stands for monthly recurring revenue and it is directly affected by churn rates related to cancellations and delinquent accounts. As you properly track your MRR and related churn rates, you can create a better product, market it more effectively, and continue to see compounding growth.
ARR
If your company offers a yearly subscription service, your churn rates will directly impact your annual recurring revenue (ARR). When customers cancel subscriptions, miss their payments, or don’t even engage with the service, you bring in less revenue and face more customer loss.
Analyzing your insights and making a plan to improve churn rate
Once you have performed an effective churn analysis it is time to take the information you have and create a plan to improve. This is where the best companies separate themselves from the pack.
Clozd’s platform and expert services make it easy to share key findings with the right teams. Insights can be automatically distributed through Slack, CRM integrations, or email summaries—so every stakeholder can act on real feedback right away.
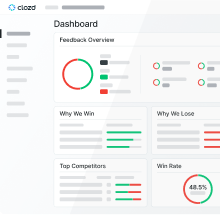
“I love the Slack integration. We have a Slack group dedicated to win-loss. As the interviews are added to the platform, they come through Slack and email in real time. And then those in that program can link directly to the full interviews from Slack and also access the dashboard in Clozd which shows our win rate, the top wins and losses, the top reasons we're winning and losing, and all the interviews that were recently posted.”
—Heather Pepe, Senior Manager of Solutions Marketing at Calendly

Share churn analysis data
One of the biggest mistakes we see with a churn analysis program or project is when the data gets siloed to an individual or small team. You should give access to a large number of stakeholders. When this happens we see various stakeholders begin to take immediate action on improving churn rate by executing strategies within their purview.
Tactics for sharing churn analysis data effectively include:

Measuring progress and improving churn rate
With all of the churn analysis data you’ve gathered you should have a solid understanding of why your customers left or why they stayed. With company stakeholders create plans to improve in the areas that influence churn and double down in the areas that helped keep a customer. These plans should include KPIs and goals to track progress.
Some initiatives we see companies could implement or improve from our churn analysis experience include:
When you know what and where the problems are, you can work to address the problem and improve the situation—whether it’s trying to improve your customer service, creating new features, or fixing bugs in your system that cause problems for customers.
One example is Xactly, which conducts ‘stay’ interviews to identify pain points and increase customer loyalty.
"We tried to get information on our own, but customers are more closed in terms of what they’ll share with us. Using a third party helped us uncover important details they just weren’t sharing with us.”
—Kathy Hassett, VP of Customer Success & Renewals
Read the full Xactly case study.
With the accurate, unbiased analysis results you get from Clozd, it’s easier for you and your team to come up with data-driven solutions that benefit your customers and your company.
Market Segmentation
One of the benefits of doing churn analysis is it helps you identify where you win and retain customers in the market. You’ll be better equipped to understand your ideal customer profile (ICP). With this data you can help focus more of your company’s efforts into bringing in new customers that will stay long term.
Clozd’s structured, qualitative feedback also helps you segment by the reasons customers stay—not just by demographics or firmographics—so you can target and retain your best-fit customers with precision.
Learn more about market segmentation here.
Churn FAQs
Customer retention rate: The percentage of customers who remain over a given period.
Revenue retention (GRR/NRR): The percentage of recurring revenue you retain, including or excluding expansions.
Cohort retention: How well specific groups of customers (e.g., by signup month, segment, or product) retain over time.Combining these views gives you a deeper understanding of where you keep and lose value.
CRM and billing data to segment by industry, product, or deal size
Customer success platforms to track health scores and at-risk customers
Qualitative feedback platforms like Clozd to run churn and retention interviews and analyze themes at scale
The most effective churn analysis programs combine quantitative data with direct customer feedback.
Listing all customers with their start date, end date (if churned), and recurring revenue.
Grouping customers by month or year and counting how many left during each period.
Applying the churn formulas from this article—for example:
Customer churn rate = (Lost customers ÷ Total customers at start of period) × 100
Revenue churn rate = (Churned revenue ÷ Retained revenue) × 100 From there, you can add filters for segments like industry, product, or contract size to see where churn is highest.
Voluntary vs. involuntary churn (e.g., customer cancels vs. payment failure)
Avoidable vs. unavoidable churn (e.g., poor fit vs. customer goes out of business)
Product-related vs. relationship-related churn (e.g., missing features vs. poor support experience)
Segmenting churn this way makes it easier to prioritize the issues you can realistically fix.
Connect with a member of our team
Talk with us


.svg)